Advanced vibration analysis with uAnalyst.
Analyzing vibration measurements is a fundamental part of any condition monitoring program. Many failures at equipment or component level can be detected, given the right tools and expertise. Therefore, we developed our uAnalyst software, the expert condition-monitoring platform for vibration engineers.
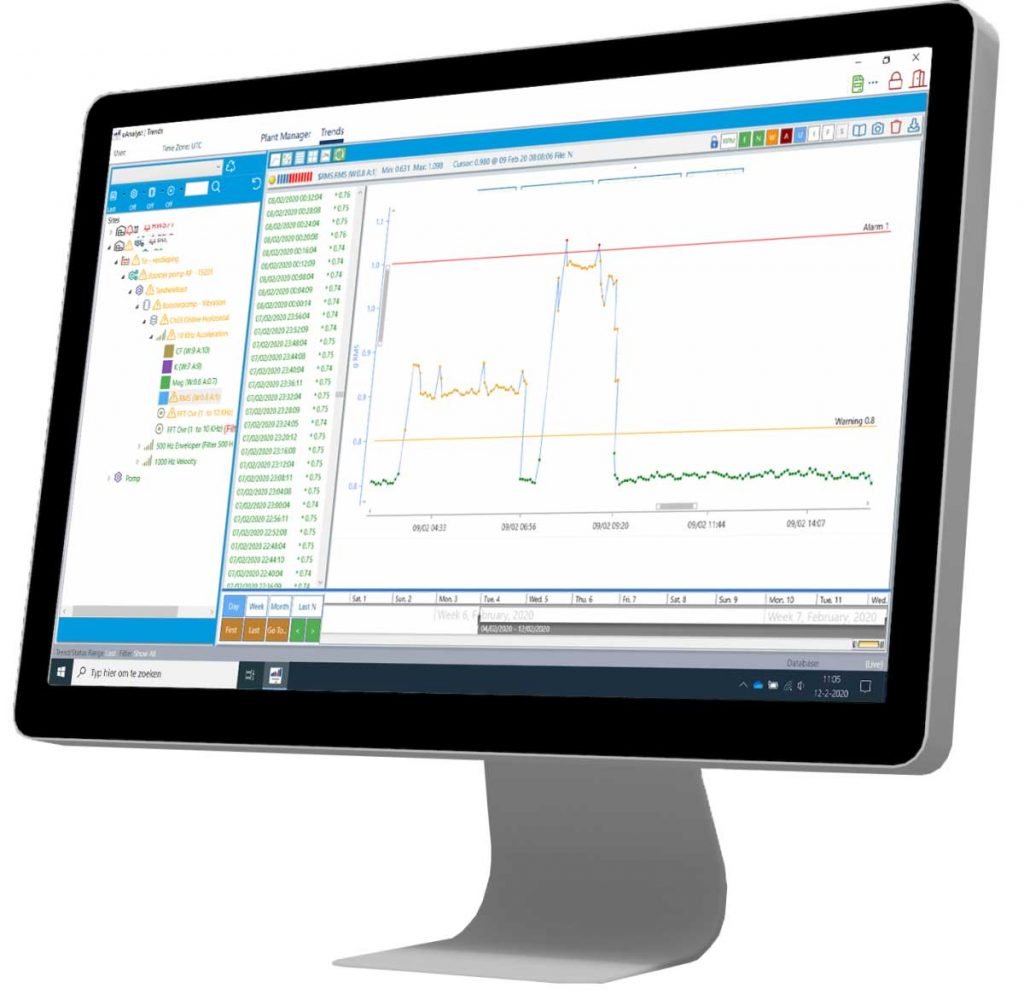
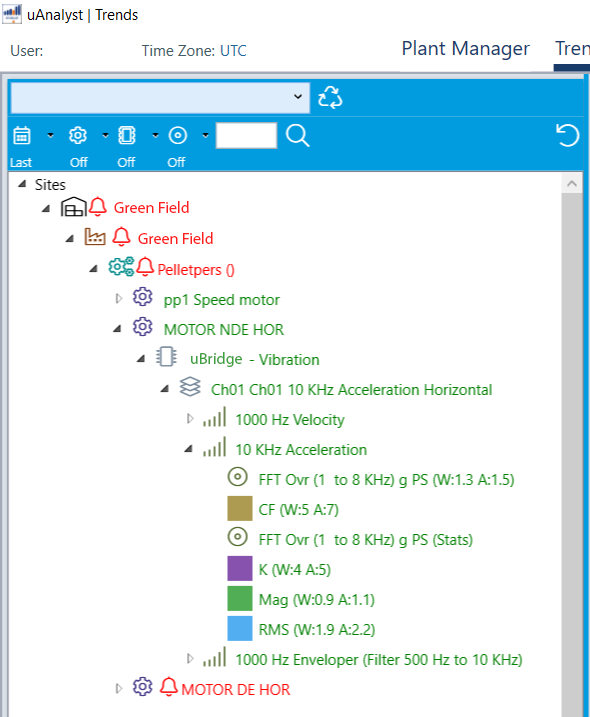
All measurements in one database
It’s our fundamental belief that all vibration data should be collected and stored in a single database, using the same method of time stamping for measurements, and a single equipment hierarchy. The power of IoT (Internet of Things) is the ability to utilize all forms of condition monitoring data. Merging sources of data has become an essential part of big data-driven analytics & applications. With UpTimeWorks we have taken every effort to ensure vibration data are available for future big data analyses.
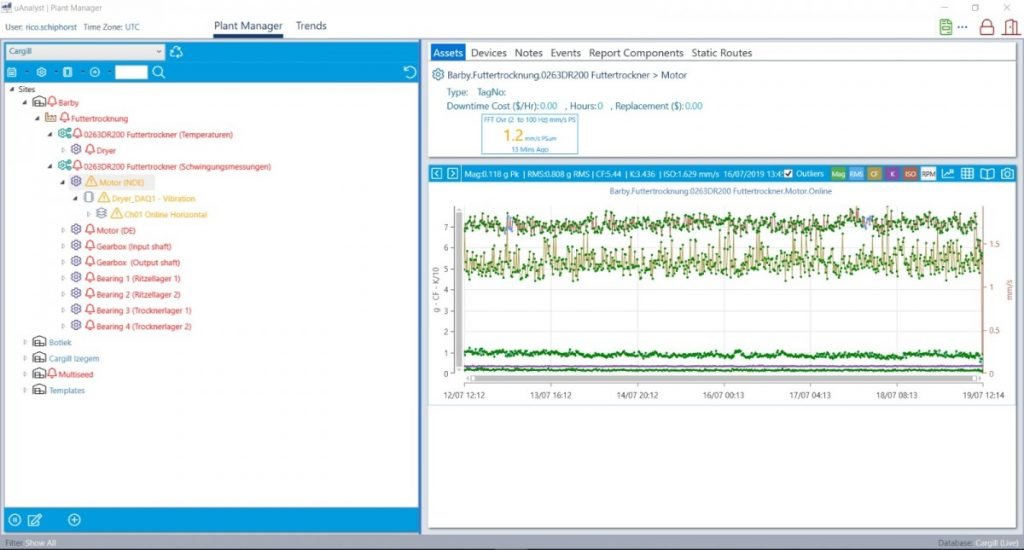
Irrespective of whether it’s an online continuous system (uBridge), one of our IoT sensors (uMote or uBlock), or a route base measurement with the uClip, uAnalyst provides the tools to monitor, analyze and manage each stream of vibration data. A functional representation of the site allows navigation between the different measurements at the component level. An important feature is that our devices take synchronous measurements, enabling more advanced analysis of measurements across different sources. uAnalyst allows you to analyze vibration data in combination with measurement data obtained from your lubrication or visual inspection program.
Early stage detection of failures
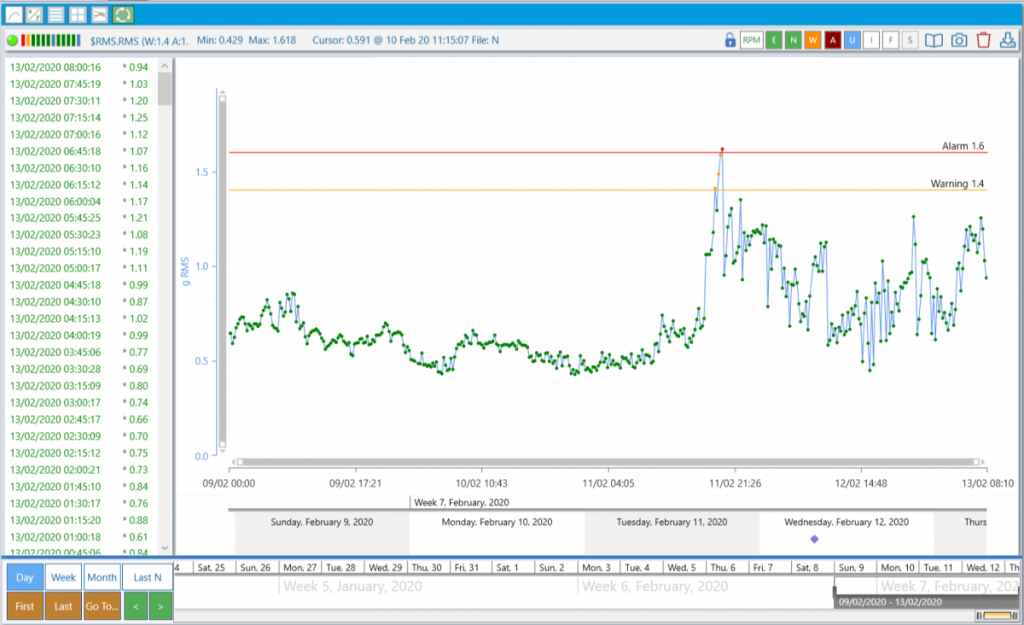
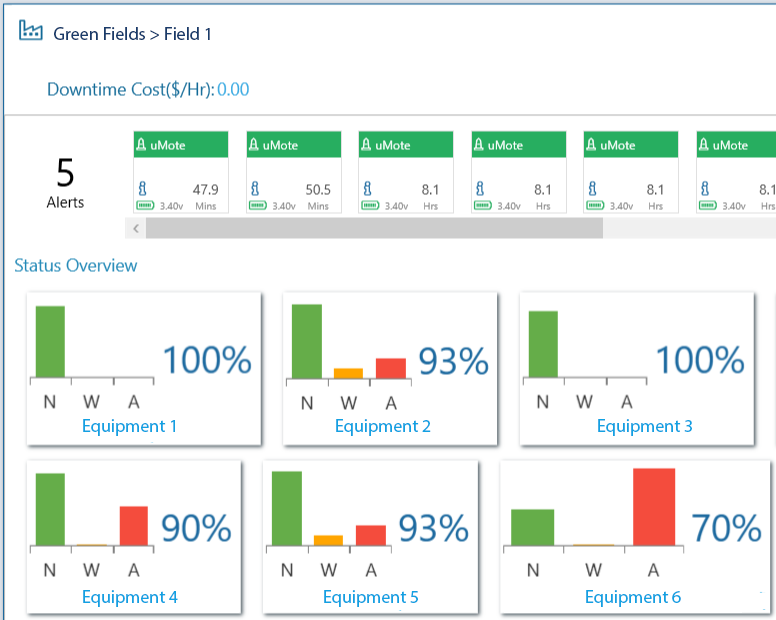
uAnalyst is designed to set up guarding thresholds per measurement, that alerts the responsible engineer or analyst in case of surpassing values. All our technology uses 24-bit data collection, which enables us to detect very low levels of vibration and distinguish between noise and signals. uAnalyst has an extensive toolset for monitoring the measurement data. For example, intricate time-series graphs can be produced based on the data of specific channels. Engineers can save and export graphs for their maintenance reports.
Intelligent data collection
UpTimeWorks is at the forefront of IoT and edge computing. Our data collection platforms provide superior agility and intelligence to ensure we collect the right data at the right moment. Whether the systems operate in surveillance mode and triggers the collection of data based on a surpassed threshold value, or operates in time mode and collect a full set of readings irrespective of the asset status, you could always rely on a full array of edge computing capabilities build into our hardware. Limiting your upstream data requirements and enabling the use of a wide variety of communication protocols, like LoRa, Bluetooth 5, 4/5G. With UpTimeWorks, you have a scalable end-to-end solution relying on high-end technology that allows efficient data management and early-stage failure detection.
Spectrum analysis
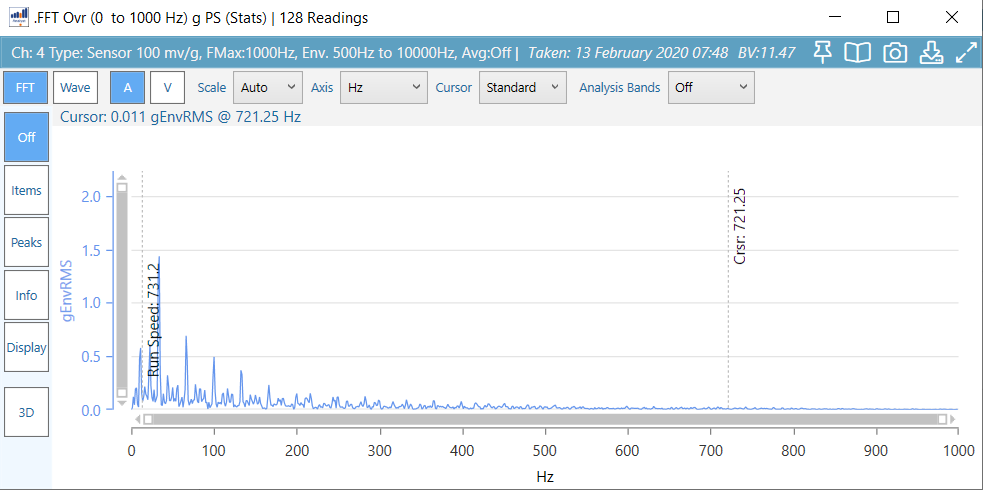
Developing trends indicate possible faults, but vibration engineers rely on more extensive metrics to pinpoint the underlying cause. For ‘threshold surpassing’ values, our products collect a more extensive measurement that includes a time waveform (the raw signal). From this waveform, the frequency spectrum is calculated using the Fast-Fourier-Transform (FFT). In uAnalyst, these spectra can be analyzed using a range of advanced functions, to determine faulty components.
Geared for
Big Data & Machine Learning
In our endeavor to make UpTimeWorks truly scalable across international borders, automated data analyses will be key to our success. UpTimeWorks designed an open data structure which will provide unique capabilities to combine data from various sources, whether it is plant historians or an OPC-UA connection. Also, using our uProxy we could provide PLC data directly into UpTimeWorks. Through labeling of data, detecting anomalies and supervised learning applications, we are paving the way for automated vibration analyses.


